Fossil fuel production from federal lands falling under Obama
Who needs energy or tax revenues?
The Energy Information Administration reports:

The Energy Information Administration reports:
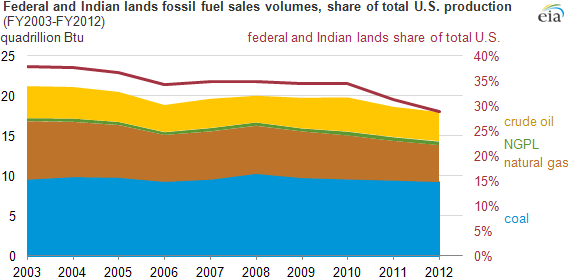
Source: U.S. Energy Information Administration and Department of the Interior.
Note: The federal fiscal year runs October 1-September 30. Natural gas plant liquids referred to as NGPL.
Note: The federal fiscal year runs October 1-September 30. Natural gas plant liquids referred to as NGPL.
Sales of fossil fuels from production on federal and Indian lands in fiscal year (FY) 2012 dropped 4% from FY 2011, according to data from the Department of the Interior compiled and summarized in a recent EIA report. This decline was largely driven by declines in offshore oil and natural gas production and coal production. In 2012, sales of fossil fuels on federal and Indian lands accounted for about 27% of total fossil fuel sales in the United States.
In FY2012, sales from production on Indian lands of crude oil and lease condensate, natural gas plant liquids (NGPL), natural gas, and coal ranged from 3% to 6% of the totals from federal lands. Since FY 2003, fossil fuel sales volumes on federal and Indian lands dropped 15%, driven by declines in offshore natural gas production and to a smaller extent by offshore oil production. However, that decline was outweighed by the 27% increase in fossil fuel production on nonfederal, non-Indian lands from 2003 to 2012, so that total U.S. fossil fuel production increased 11% over that period.
Source: U.S. Energy Information Administration based on the Ventyx Energy Velocity Suite.
Federal offshore natural gas production has declined as fields have matured, with a temporary sharp decline after hurricanes in FY 2005. Federal onshore sales volumes have generally increased over FY 2003-12, overtaking federal offshore production in FY 2007.
State offshore natural gas production has ranged from 18% to 23% of total (federal and state) offshore natural gas production from 2005 to 2011.
Source: U.S. Energy Information Administration and Department of the Interior.
Note: The federal fiscal year runs October 1- September 30.
Note: The federal fiscal year runs October 1- September 30.


Comments
Post a Comment