The early chill in the Arctic continues.
Temperature above 80 degrees north drops below freezing early, and continues to drop.
Many people have been watching the remarkable early drop in air temperature at the DMI plot here:
![meanT_2013[1]](http://wattsupwiththat.files.wordpress.com/2013/08/meant_20131.png)
This drop looks to be about two weeks early. As this next analysis of sea surface temperature shows, much of the area is below freezing. Of course in seawater, ice doesn’t form until temperatures get below 28.4°F (-2°C), so it is close, but not quite there yet. [Note: due to lower salinity in the Arctic seawater freezes at -1.8C according to this essay at NOAA by Peter Wadhams]
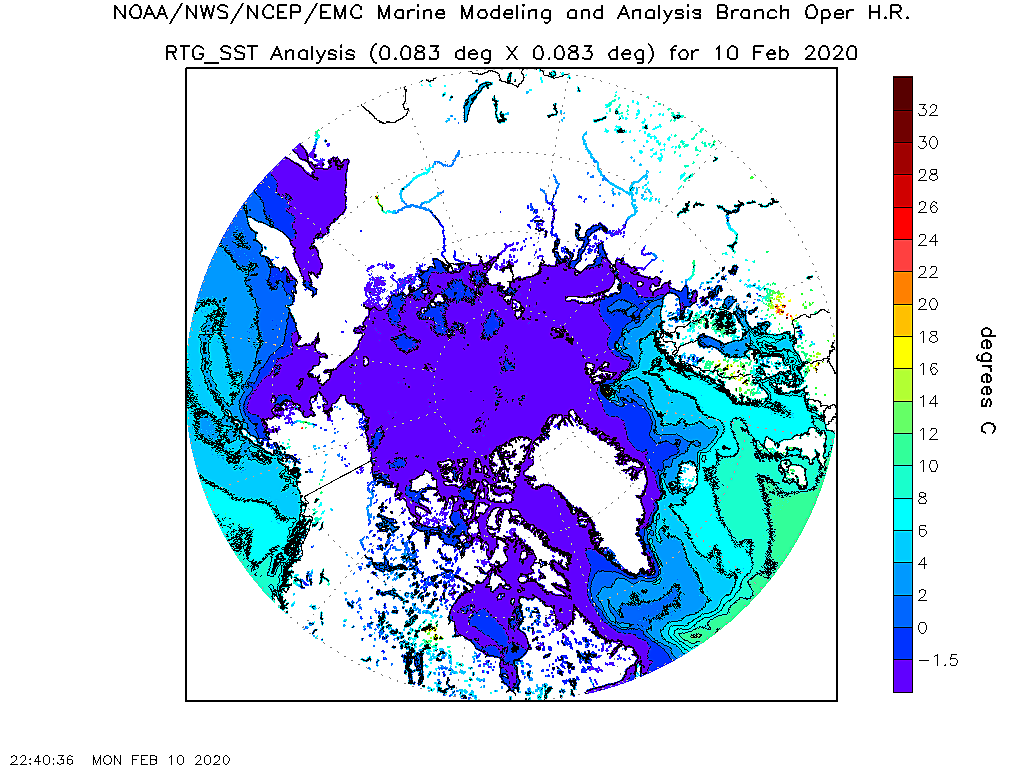 National Centers for Environmental Prediction (NCEP) Marine Modeling and Analysis Branch (MMAB) – Click the pic to view at source
The DMI sea ice plot looks to be slowing significantly, but has not made a turn yet.
![icecover_current_new[1]](http://wattsupwiththat.files.wordpress.com/2013/08/icecover_current_new11.png)
The JAXA plot isn’t quite so different from previous years, but does show some slowing:

- Japan Aerospace Exploration Agency (JAXA) – International Arctic Research Center (IARC) – Click the pic to view at source
With this slowdown becoming evident, and temperature dropping early, the possibility exists that a turn in ice melt may start earlier than usual. If it does, we might see a turn begin in about two to three weeks if there’s any linkage between 80N temperature and sea ice extent. Typically, we see a turn in Arctic sea ice melt around September 15th to the 25th.
Of interest is this plot done by the blog “sunshine hours” which shows the difference between Arctic sea ice in 2012 and 2013.
He writes:
The difference is quite dramatic if you graph the anomaly % from the 30 year mean.Until day 175 or so, the anomaly was only around -5% or so (note that the anomaly actually went positive for a few days in 2012).While 2013 was later, both started drifting down. 2013 has stabilized at -15%. At this time last year 2012 was -30%.

Click image to enlarge.
Check out all of the data at the WUWT Sea Ice reference page
UPDATE:
Some commenters have noticed a large drop in today’s most recent plot.
First, regarding this graph:
![icecover_current[1]](http://wattsupwiththat.files.wordpress.com/2013/08/icecover_current1.png)
That’s the old DMI plot, which DMI says we should now use this one on this page:
http://ocean.dmi.dk/arctic/icecover.uk.php
http://ocean.dmi.dk/arctic/icecover.uk.php
They write:
The plot above replaces an earlier sea ice extent plot, that was based on data with the coastal zones masked out. This coastal mask implied that the previous sea ice extent estimates were underestimated. The new plot displays absolute sea ice extent estimates. The old plot can still be viewed here for a while.
And, that could be either an instrument failure or a processing failure. We’ve seen spikes like that before. It might also be real data, we won’t know until the next update.
I tend to favor loss of data, as reader “DJ” points out in comments, see this image:
![satcon.arc.d-00[1]](http://wattsupwiththat.files.wordpress.com/2013/08/satcon-arc-d-001.png)
But yes, this post was edited last night at about 11PM PDT, and DMI updated the graph a few hours later.


Comments
Post a Comment