EPA Document Exposes Extreme Climate Fraud At NOAA
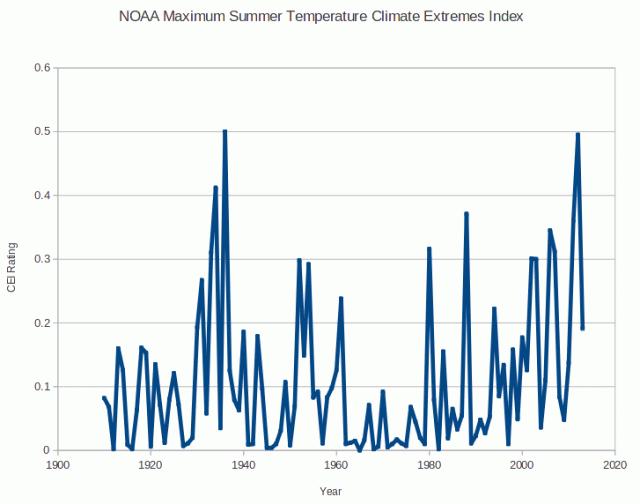
The NOAA Climate Extremes Index (CEI) is the crown jewel of NOAA climate fraud.
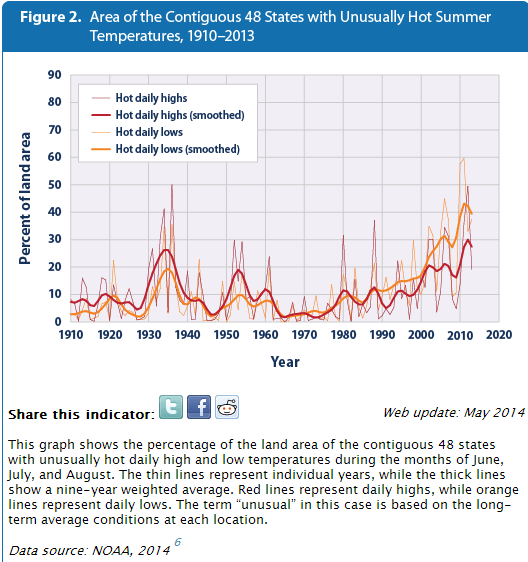
The graph below is an EPA graph derived from CEI, which shows US summers much hotter now than the 1930′s, and shows that only half of the US was hot during the summer of 1936.
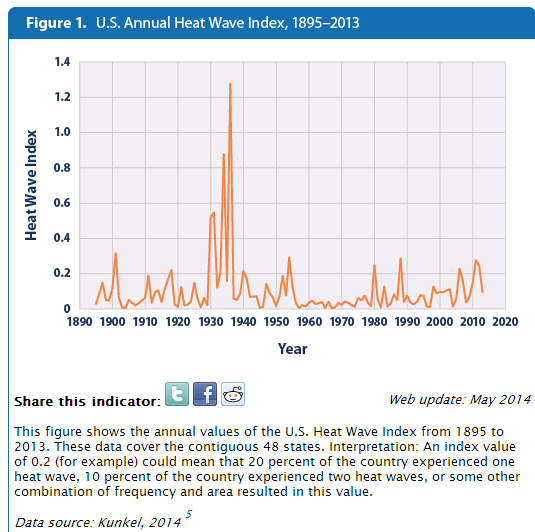
This graph is quite remarkable, because another EPA graph in the same document shows that heat waves were much more severe during the 1930s.
Heat waves in the 1930s remain the most severe heat waves in the U.S. historical record (see Figure 1). The spike in Figure 1 reflects extreme, persistent heat waves in the Great Plains region during a period known as the “Dust Bowl.”
The fraudulent EPA graph (top) is based on this garbage NOAA CEI data set, which shows the summer of 2012 as hot as the summer of 1936.
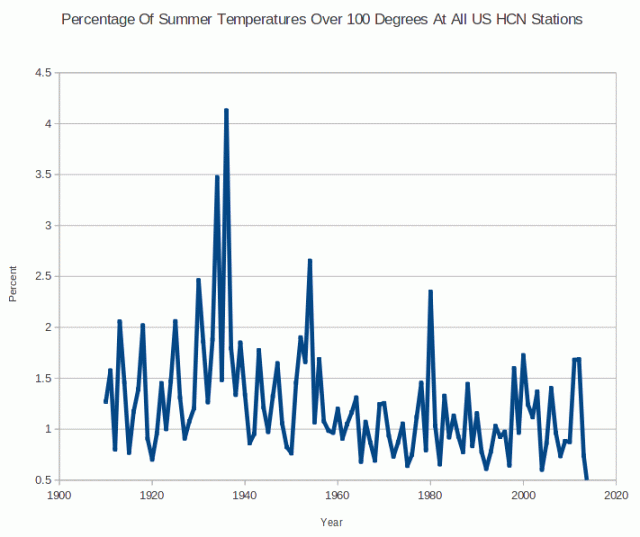
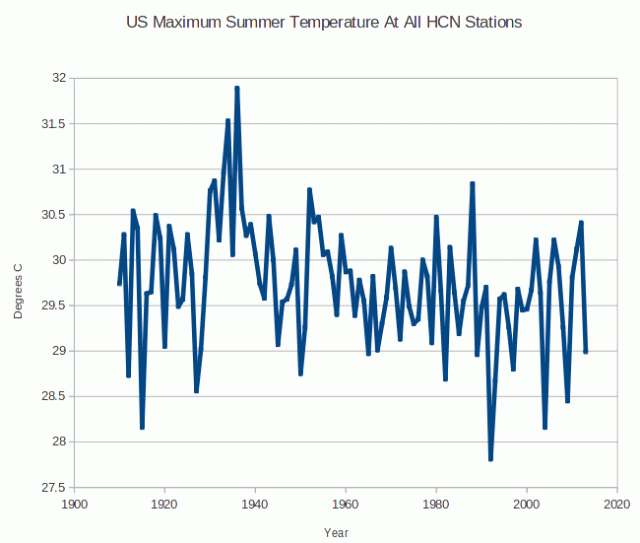
So how bad is the fraud? Worse than you can possibly imagine. The percentage of US maximum temperature readings over 100 degrees in 1936 was more than double 2012 – which didn’t even rank in the top 10.
The average maximum summer temperature in 2012 didn’t rank in the top ten, and was almost 1.5C cooler than 1936.
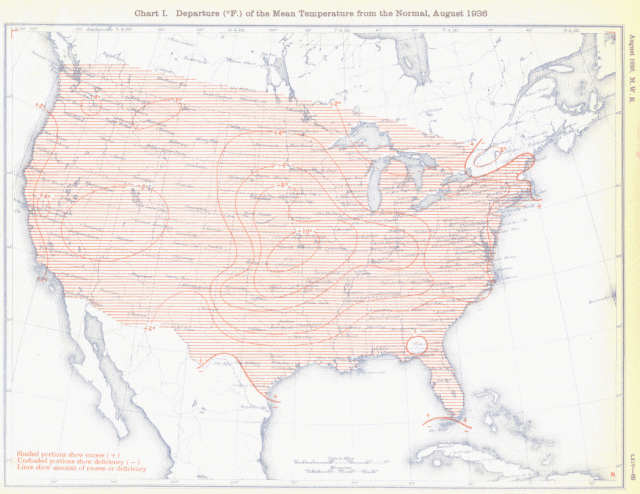
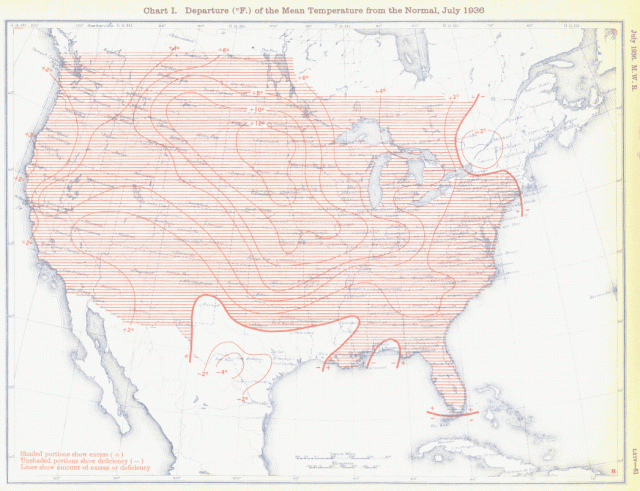
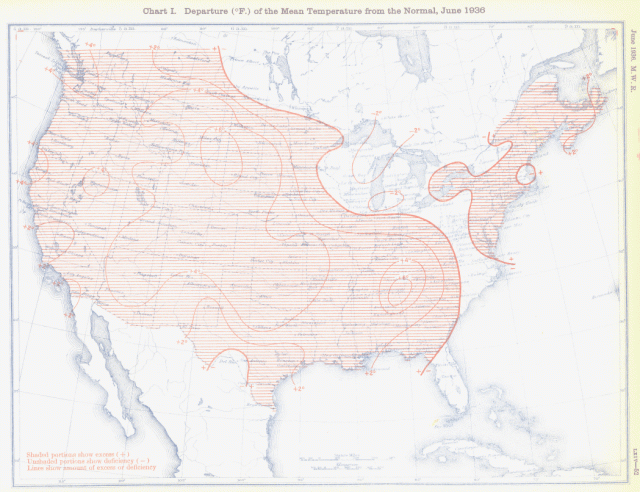
Further evidence of the NOAA data fraud includes the original Weather Bureau maps from the summer of 1936, which showed almost the entire US far above normal temperature – not 50% as NOAA now claims in their CEI data.
Temperatures in 1936 were “over 100 degrees throughout a large part of the nation“
The only question is – is this criminal incompetence, or due to criminal intent?
http://stevengoddard.wordpress.com/2014/07/12/epa-document-exposes-extreme-climate-fraud-at-noaa/


Comments
Post a Comment